
30-Second
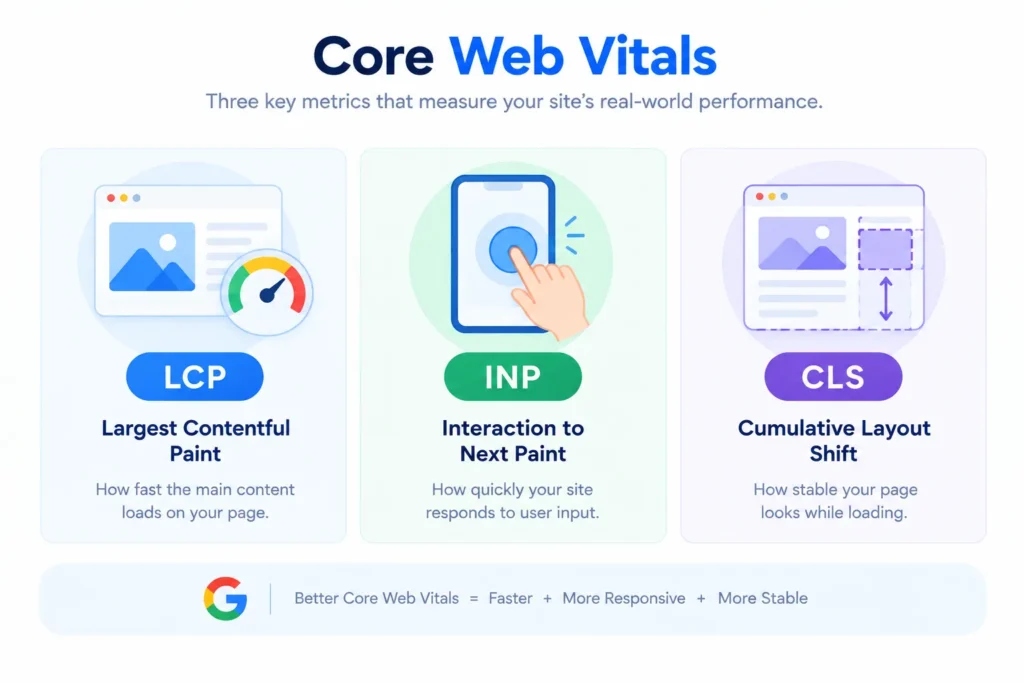
- Core Web Vitals are three specific metrics Google uses to measure real-world page experience: loading speed (LCP), responsiveness (INP), and visual stability (CLS).
- Google judges you on Field Data, real visits from real Chrome users over the past 28 days, not the Lab Data score most tools show you. The two can disagree, sometimes sharply.
- These metrics function more as a tie-breaker than a primary ranking lever. They rarely win you a top spot outright, but they can cost you one when quality and relevance are already close.
- A real, controlled Google case study found a 31% LCP improvement drove an 8% increase in sales for one retailer, concrete proof this isn’t just an abstract technical exercise.
- Google primarily judges the mobile version of your site, not desktop, so mobile performance is the score that actually counts most of the time.
- Fast, stable pages are also becoming a baseline filter for AI-driven search, since a slow page is harder for a crawler to process and less likely to get cited at all.
I still see teams chase a perfect Lighthouse score in a testing tool, ship it, and see zero ranking movement, because the score that actually matters comes from real visitors, not a lab simulation.
What Are Core Web Vitals?
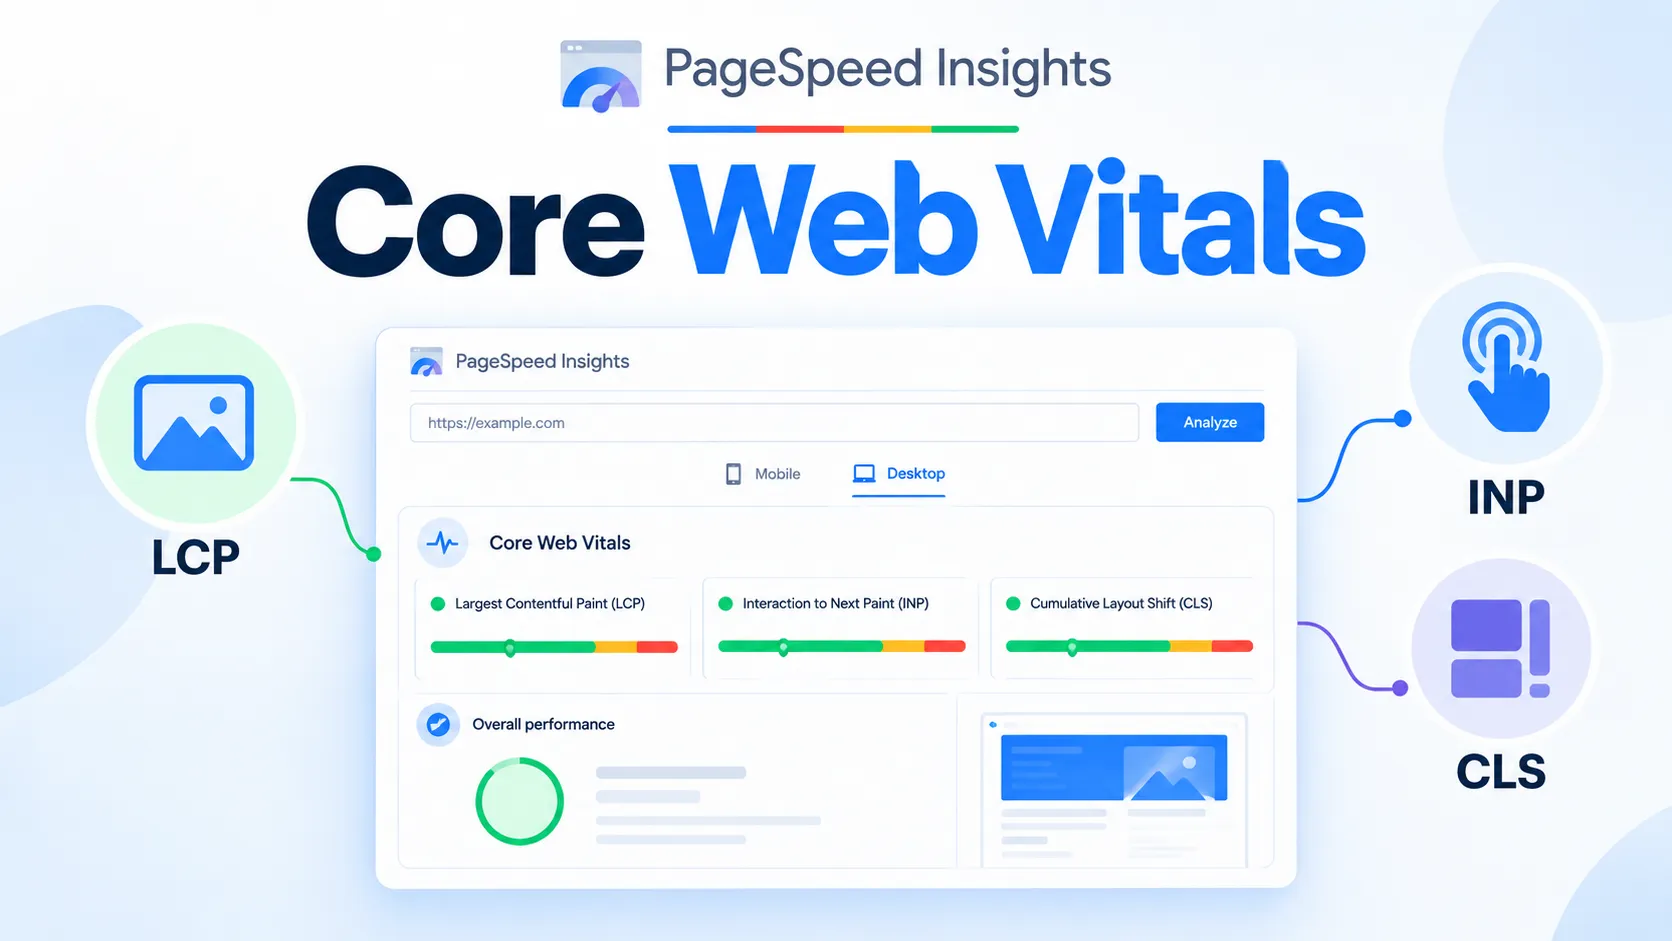
Core Web Vitals are a specific set of three metrics Google uses to measure real-world user experience on a webpage: how fast it loads, how quickly it responds to input, and how visually stable it stays while loading.
Google introduced them in May 2020 as part of a broader page experience initiative, folding them into the ranking systems that evaluate overall page quality. They aren’t a single ranking factor you either pass or fail entirely, they’re one input among many, but a poor score can hold back pages that would otherwise perform well.
The 3 Core Web Vitals Metrics, Explained
Each metric measures a different part of the experience, and each has its own pass/fail threshold.
| Metric | What It Measures | Good Threshold |
| Largest Contentful Paint (LCP) | How long the largest visible element takes to render | 2.5 seconds or less |
| Interaction to Next Paint (INP) | How responsive the page feels when a user interacts with it | 200 milliseconds or less |
| Cumulative Layout Shift (CLS) | How much visible content unexpectedly shifts while loading | 0.1 or less |
INP replaced an older metric called First Input Delay (FID) as the official responsiveness metric on March 12, 2024. FID only measured the delay before a browser could start processing the first interaction.
INP measures the full interaction, start to finish, across the entire page visit, which makes it a stricter and more accurate measure of how sluggish a page actually feels to use.
Field Data vs. Lab Data: Why Your Tool’s Score Doesn’t Match Google’s
This is the part that trips up more teams than anything else on this list.
Lab Data comes from a simulated test run in a controlled environment, the kind of score most SEO tools and site crawlers generate using Google’s own Lighthouse engine. It’s useful for debugging a specific page in isolation, but it’s a simulation, not a measurement of anyone’s real visit.
Field Data comes from the Chrome User Experience Report (CrUX), an aggregate of real, anonymized performance data collected from actual Chrome users visiting your site over the past 28 days. This is what Google actually uses for ranking purposes.
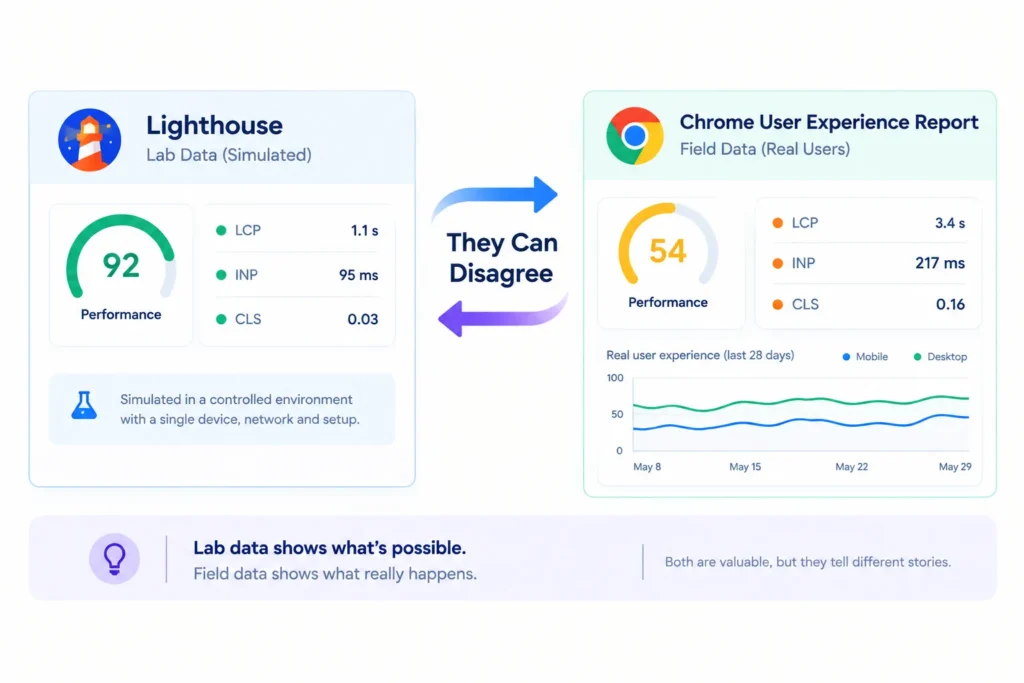
The two frequently disagree. A page can score well in a quick Lighthouse test while real users on older phones or slower connections experience something noticeably worse.
That gap is exactly what Field Data captures and Lab Data misses. If your only source of truth is a crawler-based SEO tool showing you a lab score, you’re optimizing for a proxy, not the actual signal Google is using.
A couple of technical details worth knowing here. Field Data scores are assessed at the 75th percentile of your visitors, so if 70% of your traffic has a good experience and the remaining 30% doesn’t, your page still gets judged as needing improvement.
Field Data also updates on a rolling 28-day basis, meaning a fix you ship today won’t be fully reflected in your real score for about a month, even though a fresh Lab Data test will show the improvement immediately.
There’s also a data-availability wrinkle most guides skip. If a specific page doesn’t get enough real traffic to generate its own reliable score, Google falls back to signals from a group of similar pages or the site as a whole.
One large-scale analysis of over 42 million pages found that only about 11% actually had enough traffic for page-level scoring, meaning most pages on most sites are being judged by a broader pattern, not their own individual number.
Which Metric Should You Fix First?
If you’re staring at three failing scores at once, prioritize by what your site actually does, not by which fix looks easiest.

Content-heavy sites, blogs, news, and publishers should generally tackle LCP first. Readers arriving to consume content care most about how fast that content actually appears, and slow-loading articles lose readers before they ever scroll.
Interactive and ecommerce sites should weight CLS and INP more heavily. A shifting layout that causes a shopper to misclick “add to cart,” or a sluggish response to a filter selection, costs a conversion in a way that a slightly slower initial load often doesn’t.
Within whichever metric you pick, fix your worst-performing pages first. A handful of severely underperforming templates usually drag down a site’s overall Field Data more than a large number of pages sitting just barely outside the “good” threshold.
Do These Metrics Actually Affect Rankings?
If you’re asking do Core Web Vitals affect rankings directly, the answer is yes, but as a tie-breaker more than a primary lever, and it’s worth being precise about that distinction.
Google has been consistent that Core Web Vitals are one of many signals feeding into page experience, not a dominant factor capable of overriding weak content or poor relevance on its own.
Google’s own representatives have been candid about this in public talks and social posts, at times describing the ranking boost as tiny, more of a tiebreaker between otherwise similar pages than a lever capable of moving the needle on its own. That’s a more skeptical framing than most marketing content around this topic offers, and it’s the honest one.
Two pages with comparable content and authority, though, are exactly the scenario where a real gap in these scores becomes the deciding factor.
The business case is stronger than the ranking case, and there’s real data behind it.
A documented case study from Google’s own web.dev found that Vodafone Italy improved its LCP by 31% in a controlled test and saw an 8% increase in sales, along with a 15% lift in lead-to-visit rate. That’s a direct, measured business outcome, not a ranking theory.
Google primarily evaluates the mobile version of your site for these scores, following its mobile-first indexing approach, so a fast desktop experience sitting on top of a sluggish mobile one won’t save you.
How Do You Check Your Scores?
Three tools cover most of what you need, and each serves a different purpose.
- Google Search Console’s dedicated report shows real Field Data for your actual site, grouped by URL pattern, and flags exactly which pages are failing which metric.
- PageSpeed Insights shows both Field Data (when enough traffic exists for a given URL) and a Lab Data breakdown with specific diagnostic recommendations, useful for debugging a single page in depth.
- The Chrome UX Report (CrUX) dashboard lets you query raw Field Data directly, useful for tracking trends over time or comparing against competitors at the origin level.
Start with Search Console to find which pages are failing in the real world, then use PageSpeed Insights on those specific pages to diagnose why.
LCP in Depth: What It Is, What Causes It, and How to Fix It
LCP measures how long it takes for the single largest visible element in the viewport to finish rendering. It’s the metric most people mean when they say a page “feels slow to load,” and it’s usually the hardest of the three to fix, since more things can go wrong here than with the other two combined.

The largest element isn’t always the obvious hero image. It can be an <img> tag, an image inside an <svg>, the poster image on a <video> element, a background image loaded through CSS url(), or in text-heavy pages, a large block of text itself.
Knowing which one it actually is on your specific page is the first step, not a guess.
How to find your LCP element: In PageSpeed Insights, the Diagnostics section names the exact element, and there’s a dedicated LCP tab that filters the report down to only LCP-related issues. In Chrome DevTools, open the Performance panel, check the “Screenshots” box, click “Start profiling and reload page,” find LCP marked on the timing graph, then click that node to see precisely which element it flagged.
Once you know the culprit, the fixes generally fall into five categories:
- Prioritize the loading of critical resources. Preload the LCP element itself so the browser doesn’t discover it late in the loading sequence.
- Make the files smaller. Compress images, and consider a modern format like WebP, which typically runs 25 to 34% smaller than JPEG at equivalent visual quality, based on Google’s own compression testing.
- Serve files closer to the user. A content delivery network cuts the physical distance, and therefore the time, between a visitor and your files.
- Reduce server response time. Shared hosting that’s fighting for resources with unrelated traffic spikes can quietly cap your LCP no matter how well-optimized the page itself is, in which case dedicated or cloud hosting becomes the real fix, not another round of image compression.
- Use caching aggressively. A returning visitor, or anyone hitting a cached version through your CDN, skips most of the work that caused the delay the first time.
CLS in Depth: What It Is, What Causes It, and How to Fix It
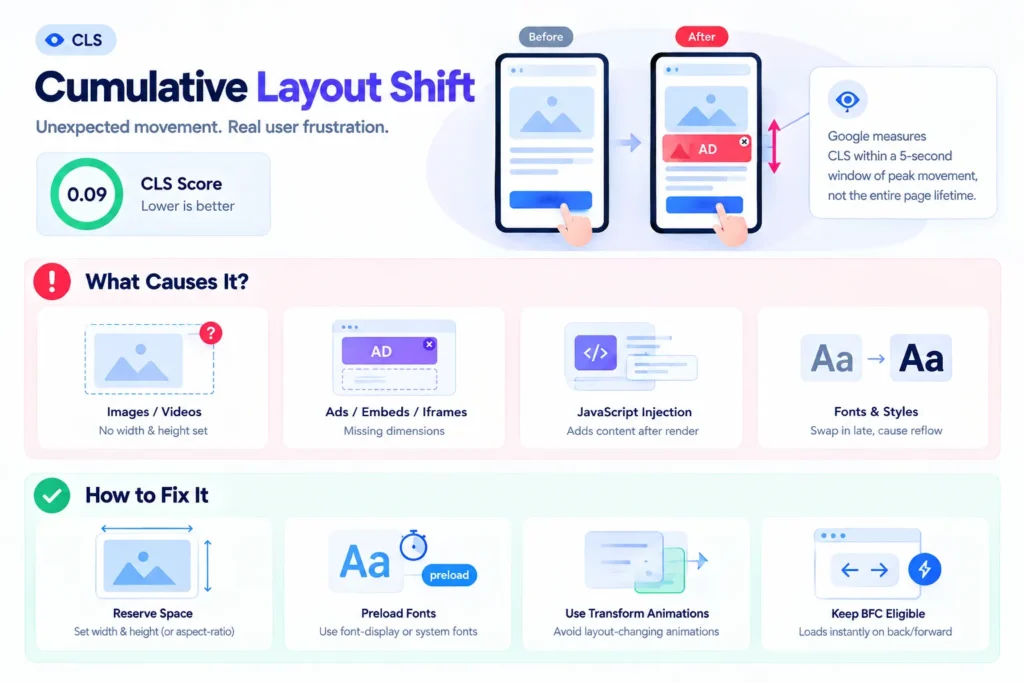
CLS measures how much visible content unexpectedly shifts position while a page loads. Google measures it within a five-second window of peak movement, not the entire page lifetime, so a shift that happens well after load generally won’t count against you.
It’s a metric most people recognize the moment they’ve experienced it, reaching to tap a link and having an ad or image push it out from under your finger at the last second.
The four most common causes: images or videos published without explicit width and height attributes, so the browser has no idea how much space to reserve before they load. Ads, embeds, and iframes with the same missing-dimensions problem. Content injected above existing content with JavaScript after the page has already rendered. And web fonts or styles applying late, causing a visible reflow when the real font swaps in for a fallback.
How to find what’s shifting: PageSpeed Insights flags this under “Avoid large layout shifts” when you filter to CLS specifically. For a more visual diagnosis, a page-load recording tool with a filmstrip view, set to highlight layout shifts and use a short frame interval, will show you the exact moment and element responsible, frequently a custom font swapping in a fraction of a second after the fallback already rendered.
Fixes for CLS generally come down to four things:
- Reserve space in advance. Always specify width and height (or an aspect-ratio) on images, video, and any embedded iframe, so the browser blocks out the right amount of space before the content arrives.
- Optimize font loading. Preload key fonts and use a font-display strategy that minimizes the visible swap, or lean on system fonts where your brand guidelines allow it.
- Avoid layout-shifting animations. Use transform-based animations instead of ones that change an element’s actual size or position in the document flow.
- Keep your pages eligible for the back/forward cache. A page that qualifies for bfcache loads near-instantly on browser back navigation, which also sidesteps a fresh round of layout shifts entirely.
INP in Depth: What It Is, What Causes It, and How to Fix It
INP measures how responsive a page feels across every click, tap, and keyboard interaction during the entire visit, not just the first one, using data from the browser’s Event Timing API.
The underlying cause is almost always the same: JavaScript competing for a single main thread. A browser can only run one task on that thread at a time, so while a long script is executing, the page simply cannot respond to whatever the user just clicked.
The longer that task runs, the longer the delay feels. The gaps between tasks are the only windows the browser has to jump over and handle the user’s input instead.

How to find what’s blocking input: INP itself only shows up in real Field Data, since a lab test has no user to interact with the page. For a lab-testable proxy, look at Total Blocking Time (TBT) in PageSpeed Insights, which flags the same long-task problem in a way you can measure before a page ever reaches real visitors.
Fixes for INP generally come down to five things:
- Reduce the total amount of JavaScript running on the page, especially anything loaded but never actually used.
- Load non-critical JavaScript later, after the content the user actually came for has already rendered.
- Break up long tasks into smaller chunks so the browser gets more frequent opportunities to respond to input between them.
- Offload heavy computation to a web worker, which runs on a separate thread and doesn’t block the main one at all.
- Consider server-side rendering or prerendering for content-heavy pages, so the browser has less client-side work to do before the page is genuinely interactive.
A Bit of History: How This Reshaped Other Parts of SEO
Worth knowing if you’ve worked with older technical SEO advice: the introduction of Core Web Vitals directly changed Google’s stance on other technologies too.
Once these metrics gave Google a direct way to measure real-world speed, AMP stopped being a requirement for placement in the Top Stories carousel. A fast, well-optimized standard page could now compete for that same visibility without the trade-offs AMP required.
It’s also worth knowing that a few related metrics show up in diagnostic tools without being official ranking signals themselves. Time to First Byte (TTFB) and First Contentful Paint (FCP) act as supporting indicators for load speed.
Total Blocking Time (TBT) and Time to Interactive (TTI) help diagnose responsiveness issues in Lab Data specifically, since Lab tests can’t measure INP directly. None of these four are Core Web Vitals themselves, but they’re useful for narrowing down why a page is failing one.
Do Core Web Vitals Matter for AI Search Too?
Increasingly, yes, in a way that extends beyond classic ranking.
AI crawlers retrieving and citing content work faster and more reliably against pages that load cleanly and render predictably. A slow, unstable page is simply harder for an automated system to process within its time and resource constraints, which makes technical performance a quiet gatekeeper for AI visibility, not just classic search rankings.
I’ve covered the fuller picture of what still matters for page experience in what still matters above the fold, and the broader AI-visibility context in what AEO actually requires.
Frequently Asked Questions
What are the three Core Web Vitals?
Largest Contentful Paint (LCP), which measures loading speed, Interaction to Next Paint (INP), which measures responsiveness, and Cumulative Layout Shift (CLS), which measures visual stability.
Do these metrics directly affect my Google ranking?
They’re one signal among many, functioning more as a tie-breaker between otherwise comparable pages than as a dominant ranking factor on their own. A poor score won’t sink great content, but it can cost you a close call.
Why does my SEO tool show a different score than Search Console?
Most SEO tools show Lab Data, a simulated test run in a controlled environment. Search Console shows Field Data, aggregated from real Chrome users. The two measure different things and frequently disagree.
What replaced First Input Delay (FID)?
Interaction to Next Paint (INP) officially replaced FID as a Core Web Vital on March 12, 2024. INP measures the full duration of an interaction rather than just the initial delay, making it a more complete responsiveness metric.
Does mobile or desktop performance matter more here?
Mobile, in most cases. Google primarily evaluates the mobile version of your site under its mobile-first indexing approach, so mobile performance is generally the score that counts.
How long does it take to see a ranking impact after fixing these issues?
Field Data uses a rolling 28-day window, so a fix needs at least that long to fully reflect in Google’s data, and ranking effects, where they show up at all, typically follow with some additional lag after that.
Bottom Line
Core Web Vitals measure something real: whether your page loads fast, responds quickly, and stays visually stable for actual visitors, not just in a lab test. They’re rarely the single factor that wins or loses a ranking, but they’re a real business lever, as the Vodafone case study shows, and an increasingly real gatekeeper for AI visibility too.
Check your Field Data in Search Console before trusting any lab score, fix mobile performance first, and treat this as ongoing maintenance rather than a one-time project.